ChromIdent
ChromIdent by Lablicate can be used to compare complex chromatograms and build up databases to search through.
The design of ChromIdent™ dates back to 2010, when an automated approach to analyze complex pyrolysis GC-MS was developed for the pulp and paper industry as data evaluation was a bottleneck.

A database approach was chosen, and with the establishment of Lablicate as a company in 2013, the idea was to convert this prototype into a ready-to-use application with a broader scope. The design goal from the very beginning was to make it user-friendly. Not a utility that only computer scientists can run and repair, but something for an expert with chromatography domain knowledge, not scripting languages or databases.

Start by downloading OpenChrom. While OpenChrom is Free and Open Source software, ChromIdent™ is not. It is available from the Lablicate marketplace for purchase. You can also ask for a live demo or trial version. Students, when registered with their university e-Mail, can apply for a free license. We were also students once, and we feel you.

In the OpenChrom main menu, choose Plug-ins - Install Extensions and search for ChromIdent. Click next, install, and restart the application.
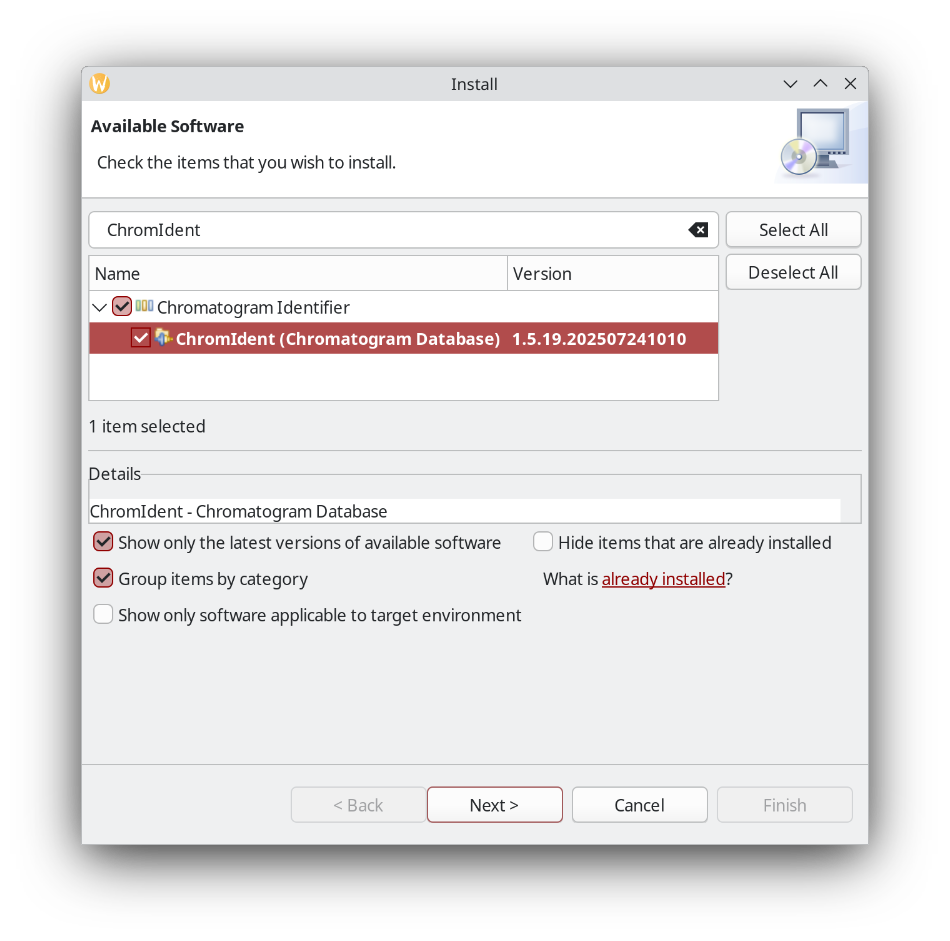
On the welcome screen a new tile appears. Click it or choose Window - Perspective Switcher and choose ChromIdent (Database) as we want to create our own DB first.
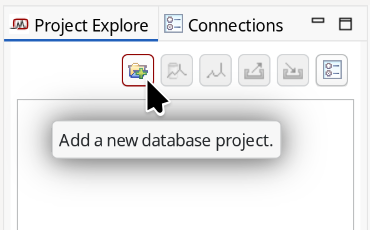
In the Project Explorer create a new folder.
It also shows where all the files are being stored so you can find them later, back them up, and share them with colleagues.
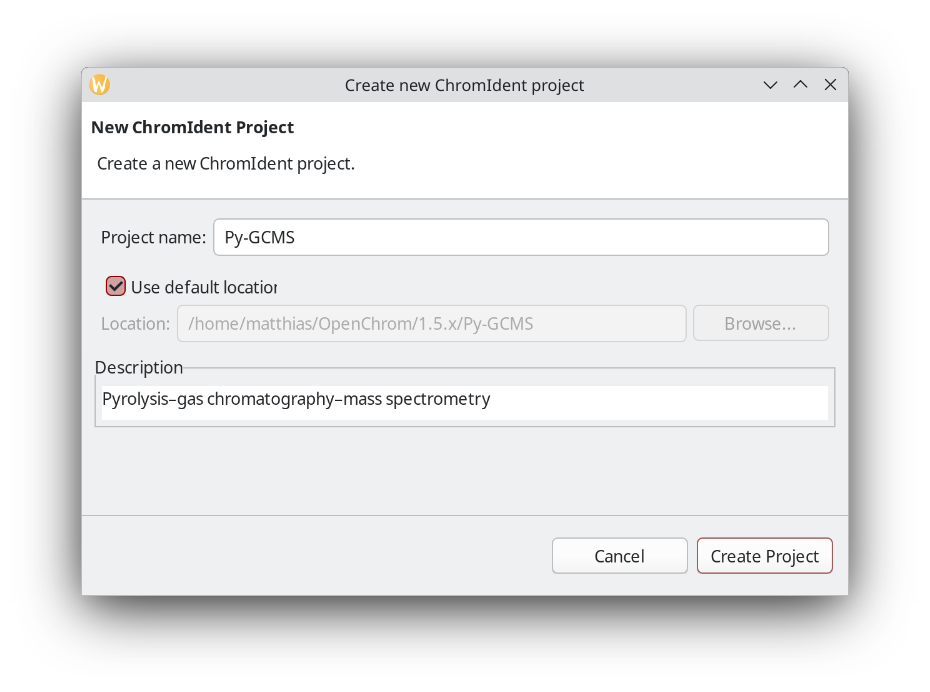
Next, create an empty fingerprint database inside that new folder.
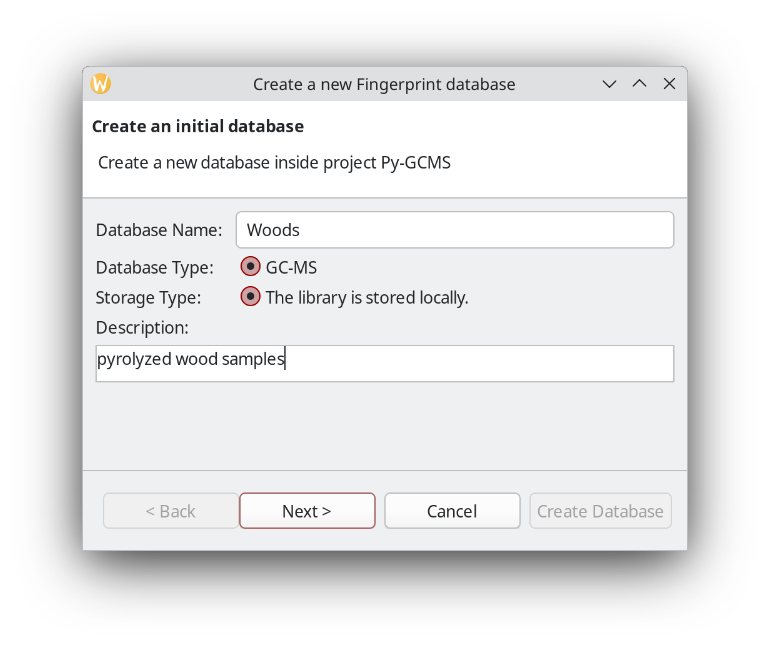
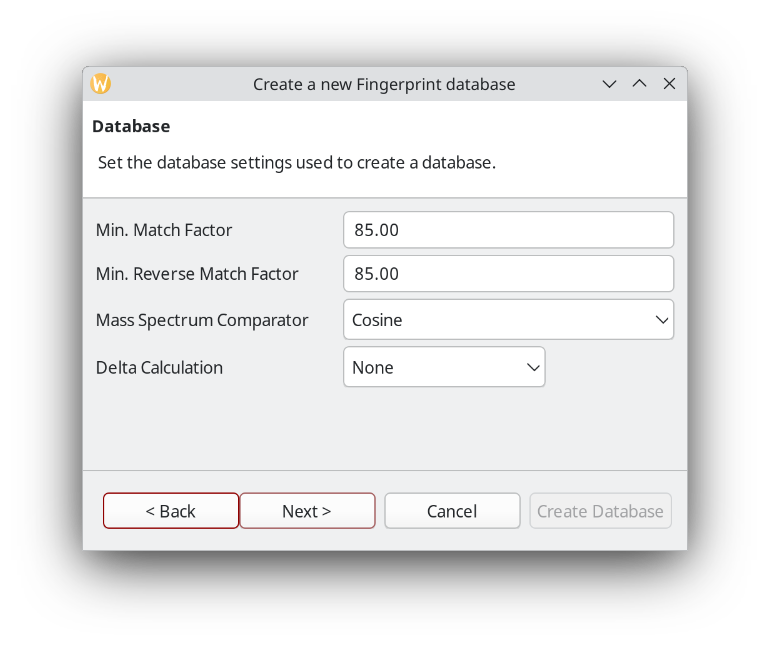
When setting up a database, it is a good idea to be more strict about the match factor when creating the database compared to the query later.
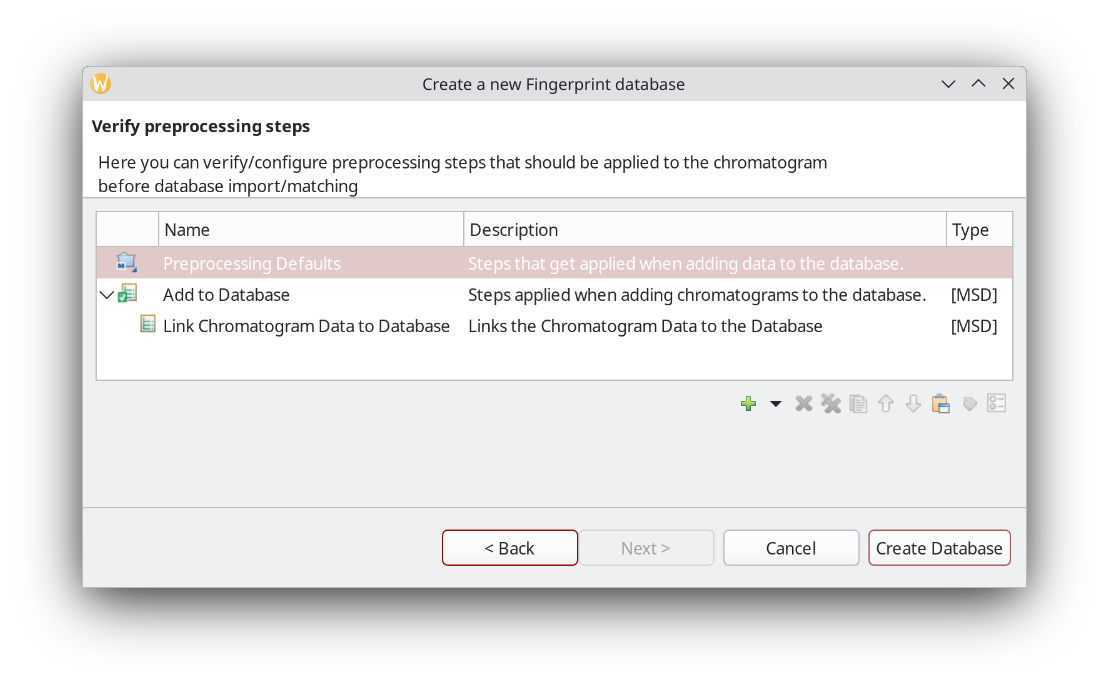
You can setup pre-processing steps in ChromIdent™. Alternatively, pre-process your chromatograms in the Data Analysis perspective. It also has a batch processing option.
In this example we use files that are already processed. That is, they have peaks detected, area integrated, and substances identified.
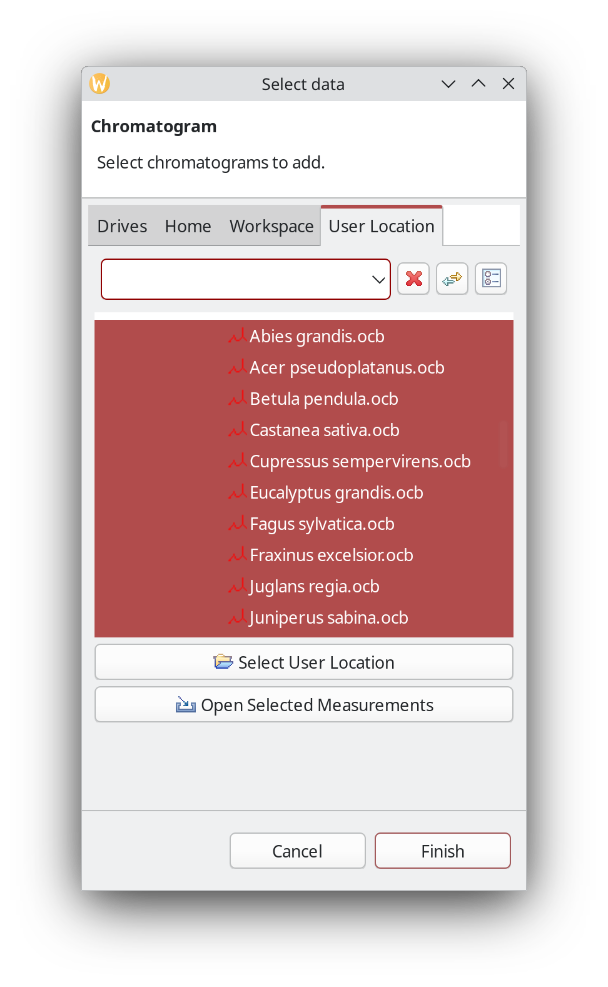
It is also possible to add group names. In this case it could be hardwood vs. softwood, for example, but here we are actually interested if ChromIdent™ can be used to identify the taxonomic species, so it is left as is.
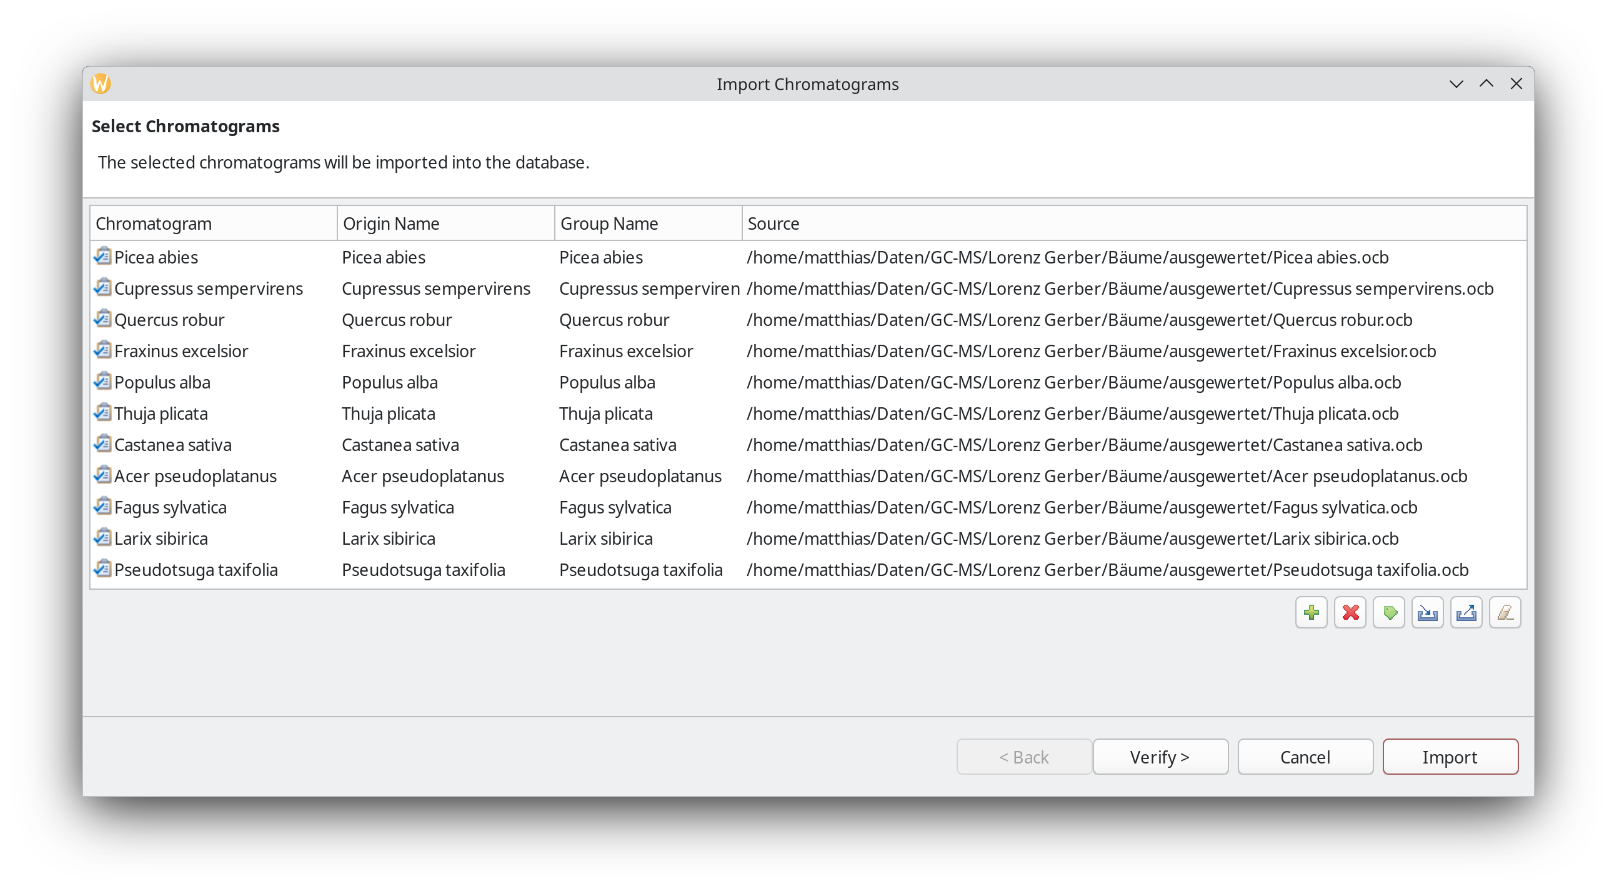
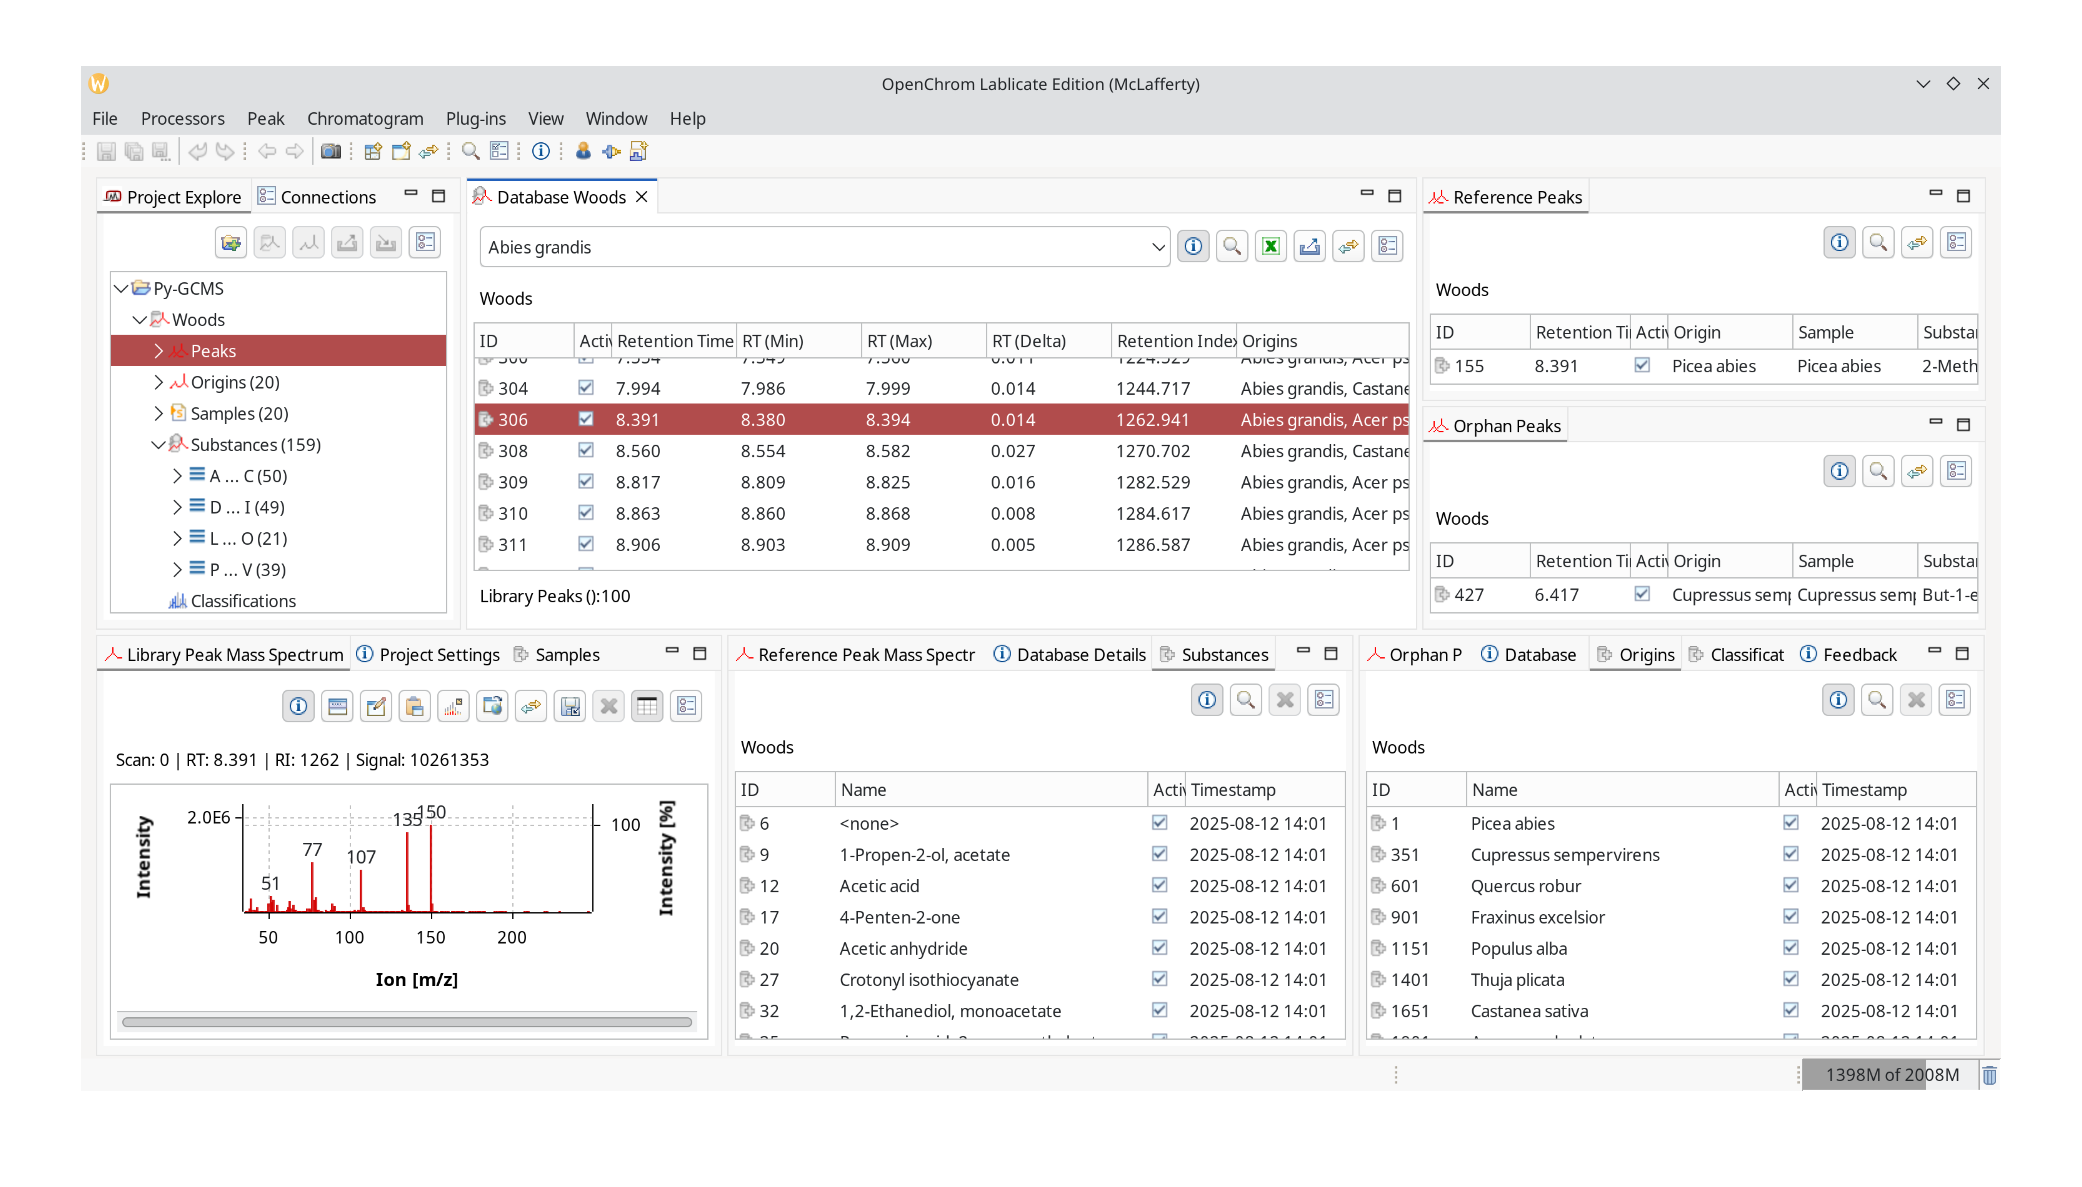
Clicking Import the database is getting created, and its contents will be displayed in the next step. What ChromIdent™ does is take every peak and compare the mass spectra. The substances as in peak labels, are still useful for interpretation later. It will determine the origins of each peak and check how abundant it is in the samples.
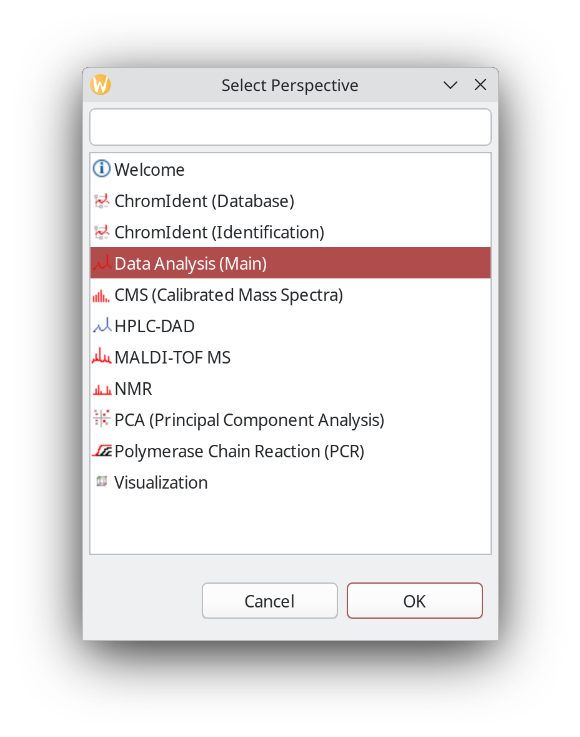
Next click Window: Perspective Switcher and go to Data Analysis again.
We pick a file that is not part of the database that has been processed in the same way as the files used for database creation.
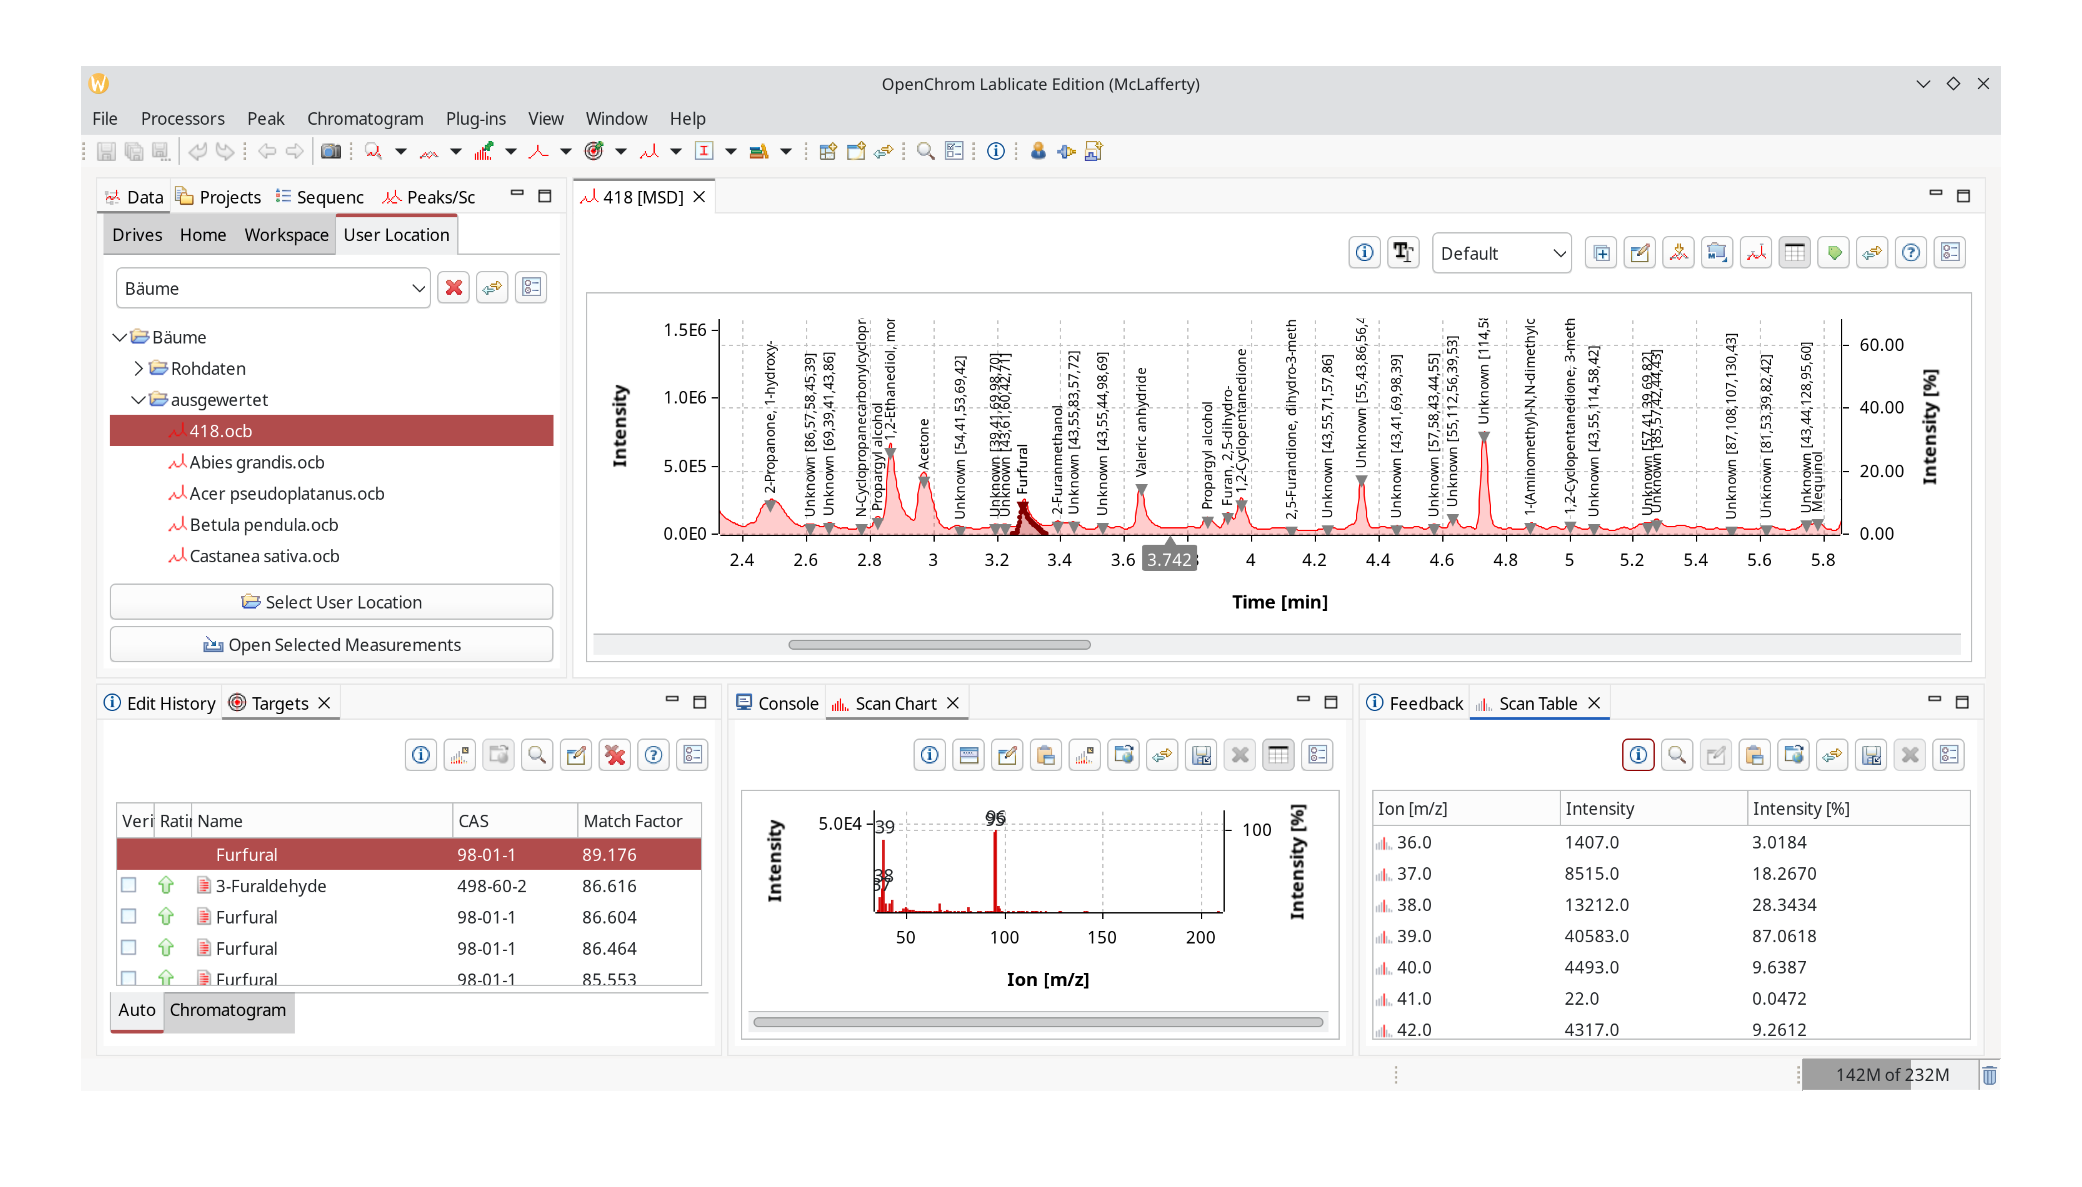
Be sure to zoom out as the next step takes the chromatogram selection into account. Choose Chromatogram Identifier: ChromIdent™ to trigger the database search.
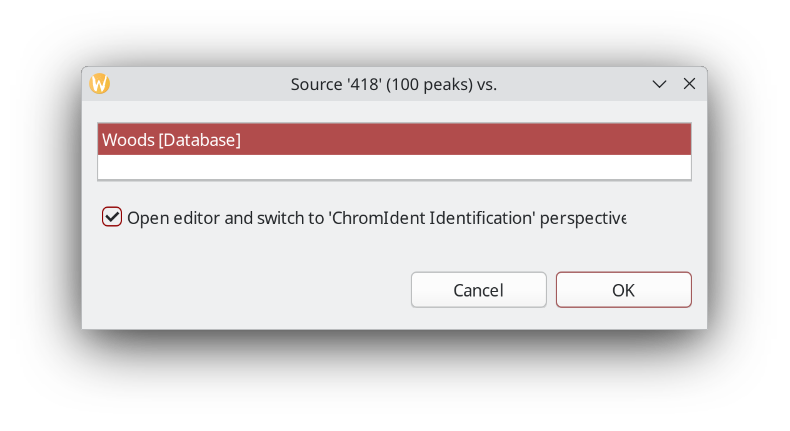
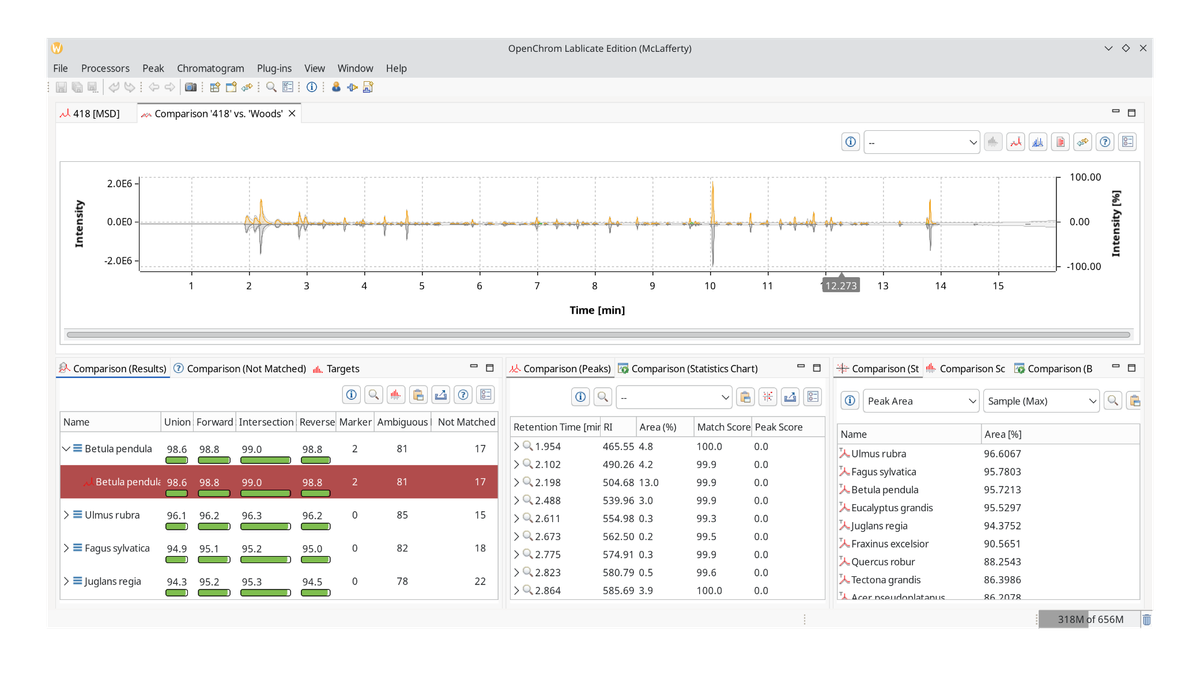
It will ask for the database to query against and by default also switch to the new perspective ChromIdent™ (Identification). It contains a comparison view and a hit list.
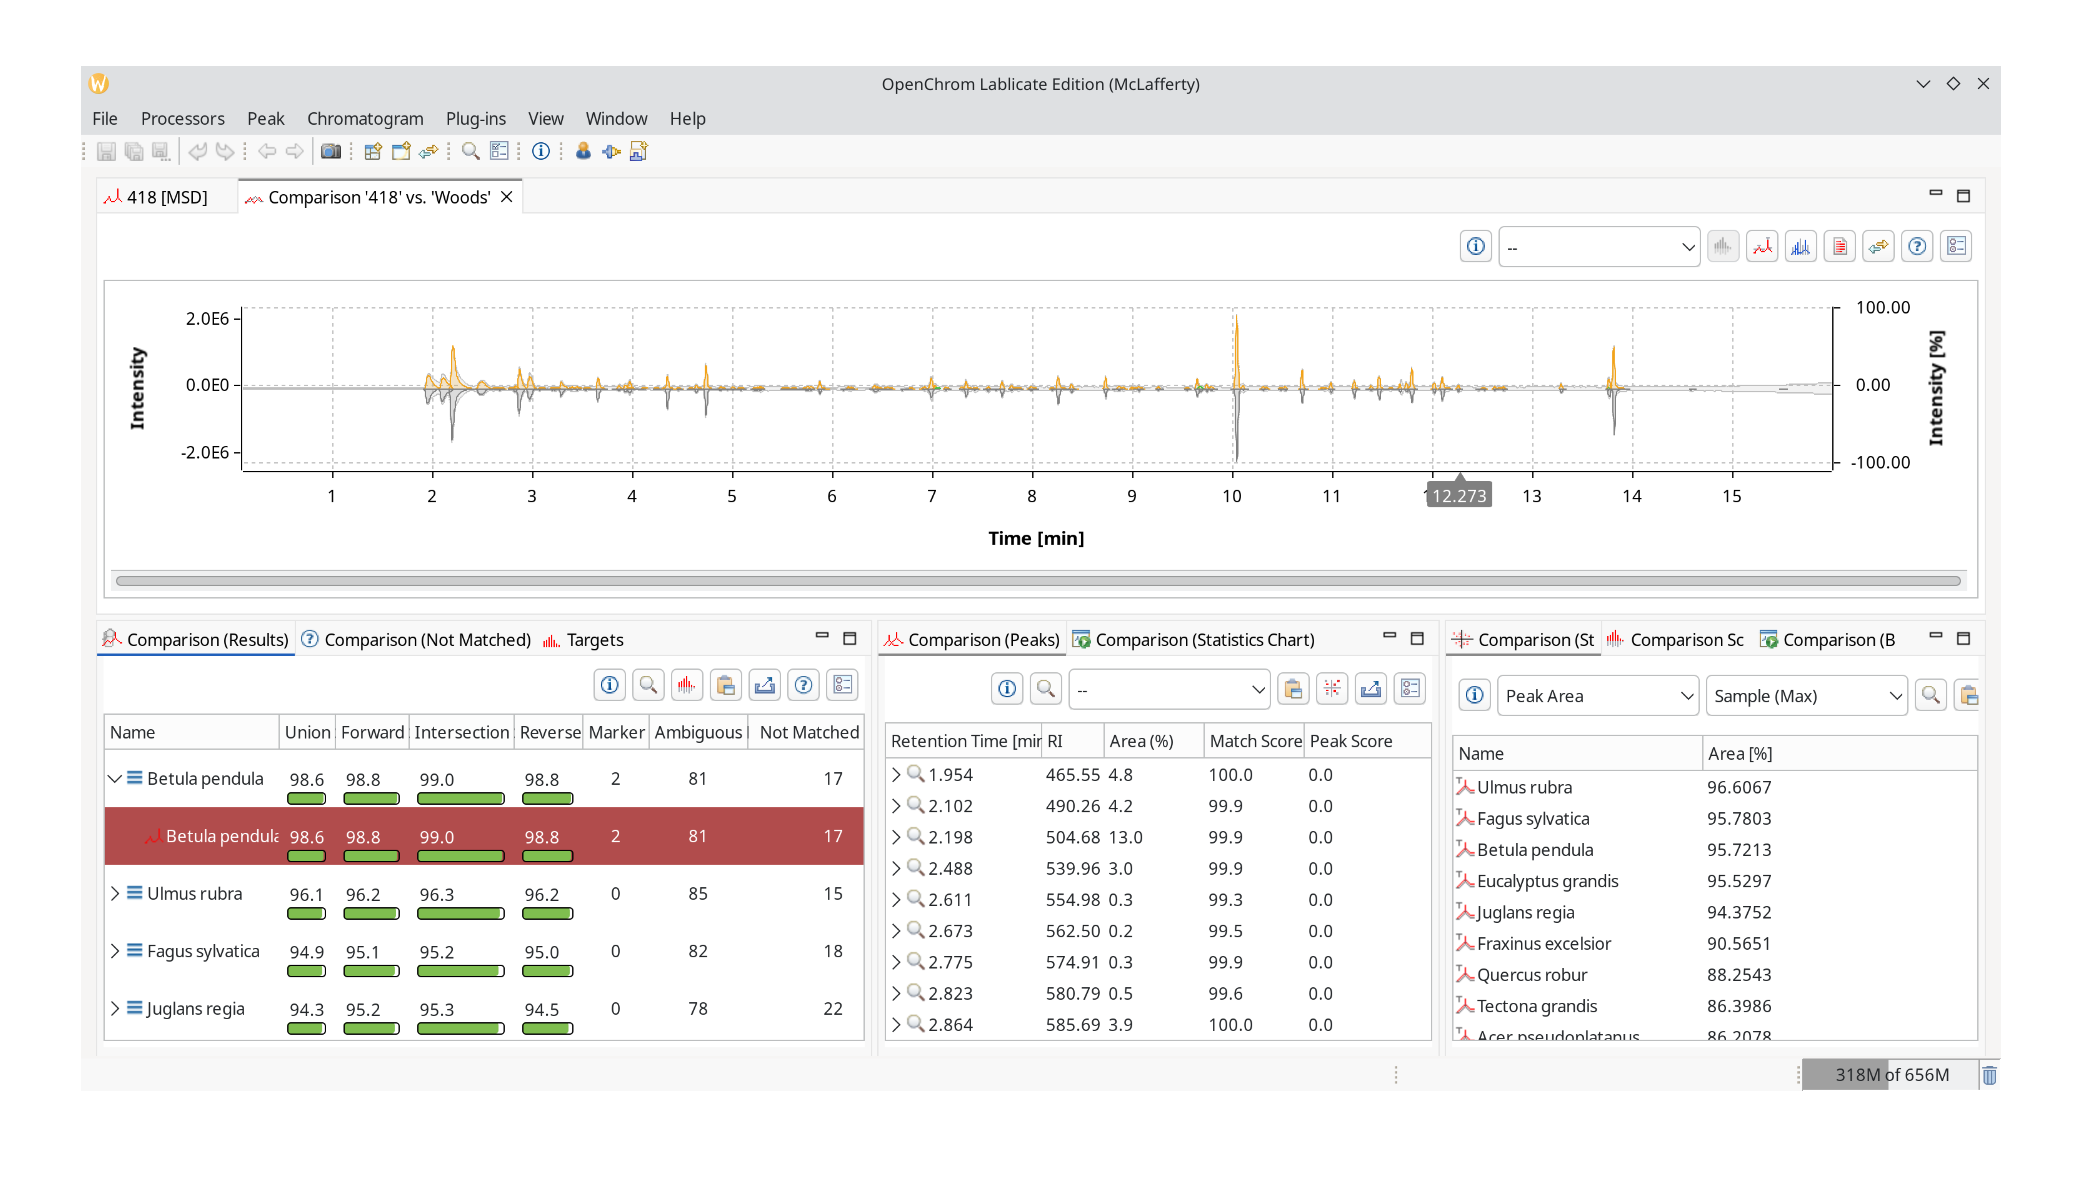
Start from the bottom left with Comparison (Results). It lists the number of marker (unique) hits, ambiguous peaks that are also part of other chromatograms, and peaks that were not matched. It has four score markers: union, forward, intersection, and reverse similarity index. Click the help button to open an explainer.
|
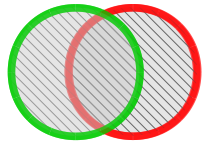
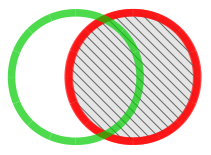
Union Similarity Index (uSI) All peaks whether present in unknown or library chromatogram are taken into account for comparison. |
|
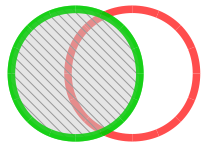
Forward Similarity Index (fSI) All peaks only present in unknown chromatogram are taken into account and matched against peaks in library chromatogram. |
|
Reverse Similarity Index (rSI) All peaks only present in library chromatogram are taken into account and matched against peaks in unknown chromatogram. |
|
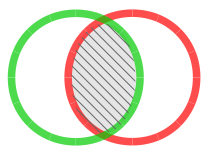
Intercept Similarity Index (iSI) Only peaks present in both unknown and library chromatogram are matched and compared. |
This is important because we are potentially dealing with mixtures or chromatograms that contain many peaks that match against any sample. However, we can quickly rule out those chromatograms with overabundant peaks because the reverse match will be poor.
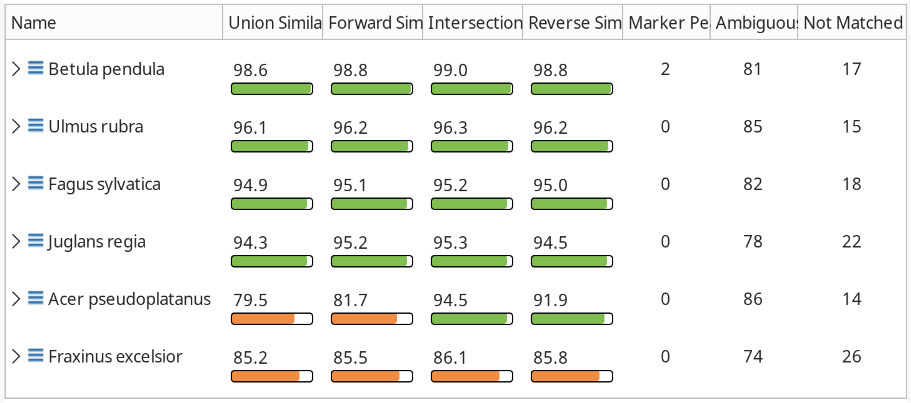
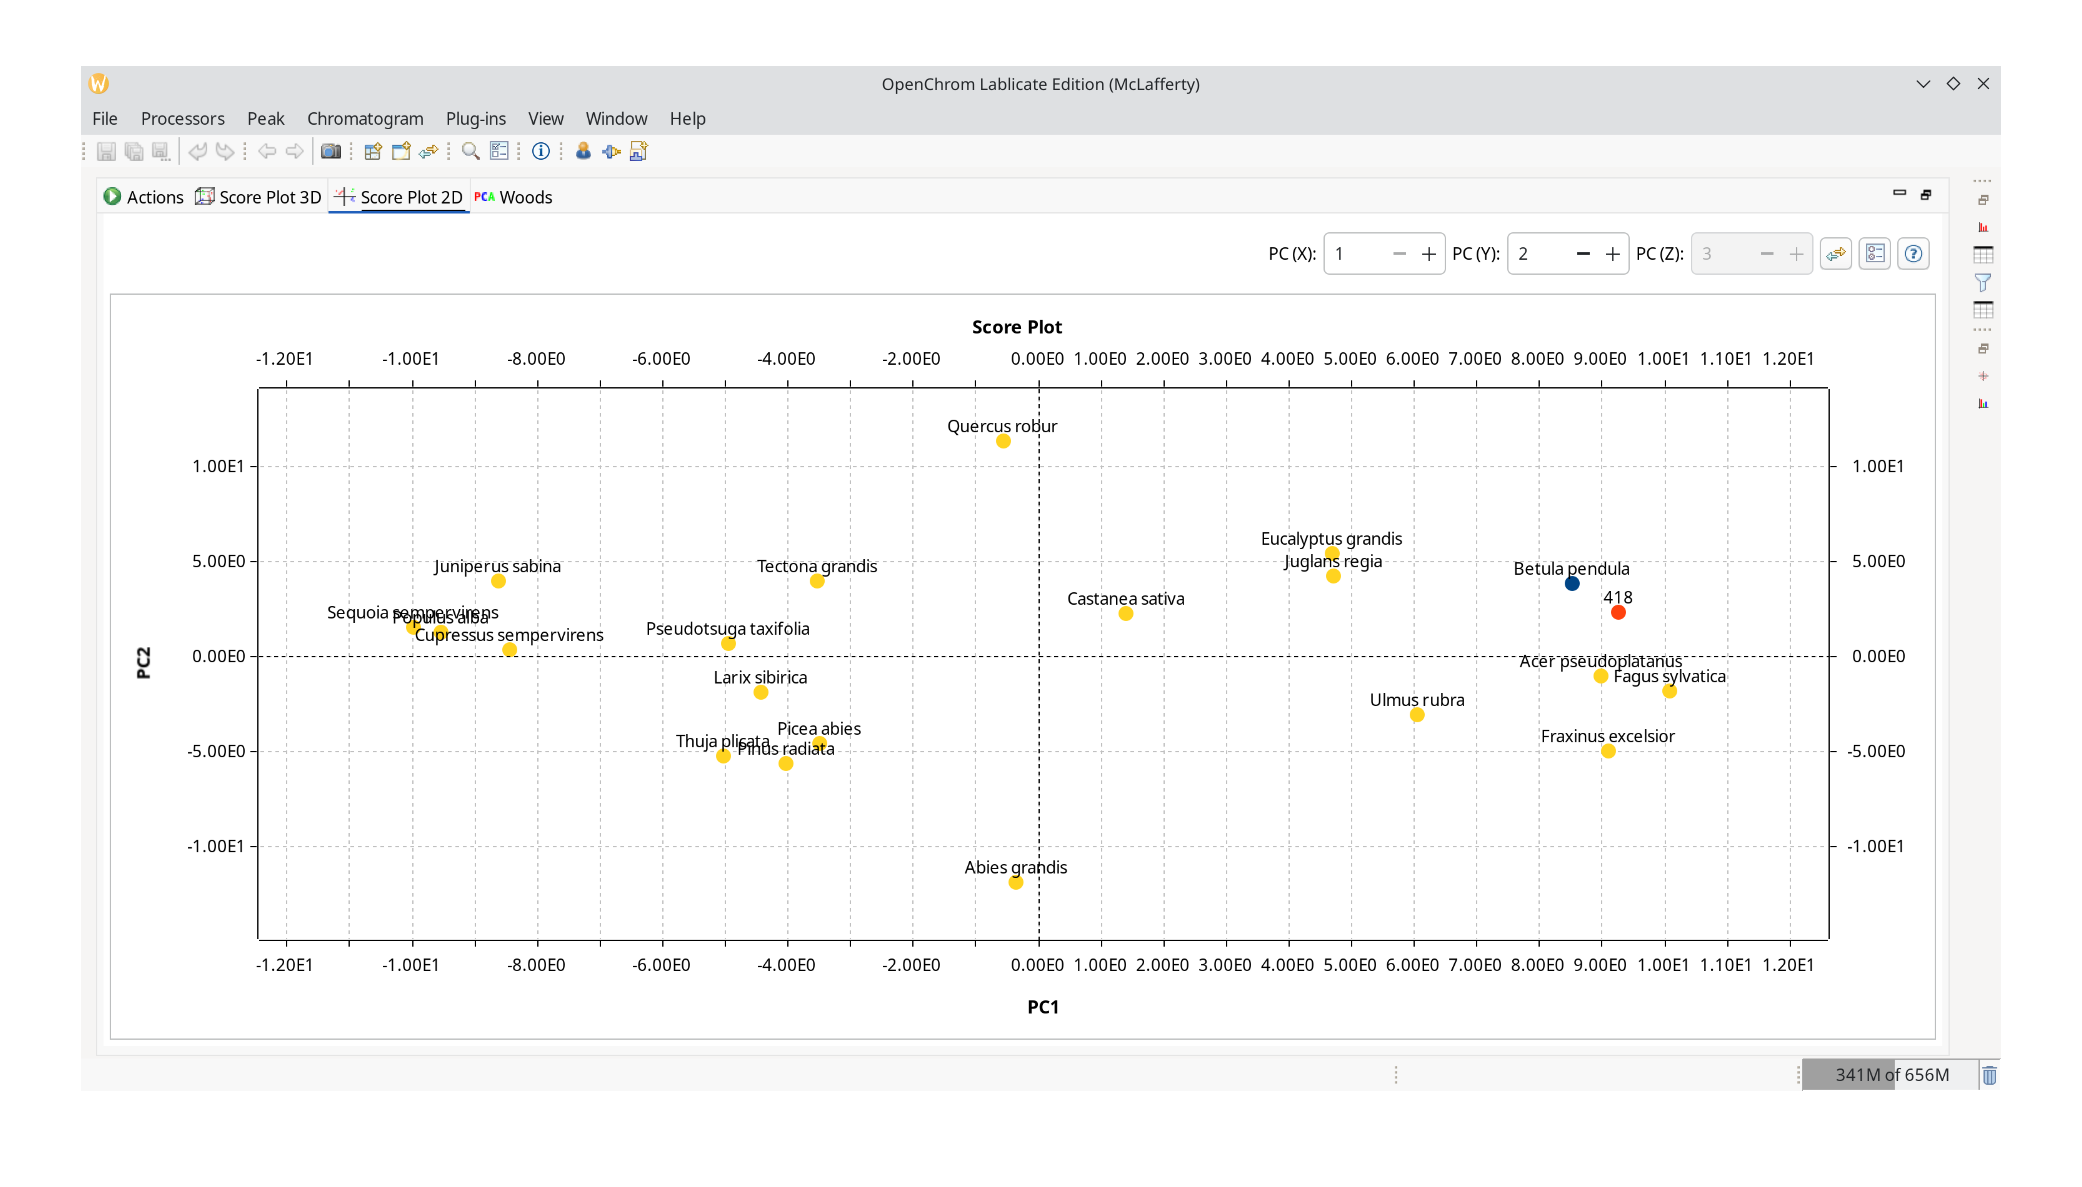
In our case, Betula pendula the European white birch, gives us a good hit in all similarity indices, so maybe we are dealing with another birch here. To prove our point, we can click the Export PCA Matrix button in the Comparison (Peaks) view, which lists the peaks by marker, ambiguous, and unmatched.
The PCA (Principal Component Analysis) perspective is part of the Open Source release and does not require an additional license. In the Actions screen, click Files. We choose the default settings here and select the File Data Matrix that we just saved.
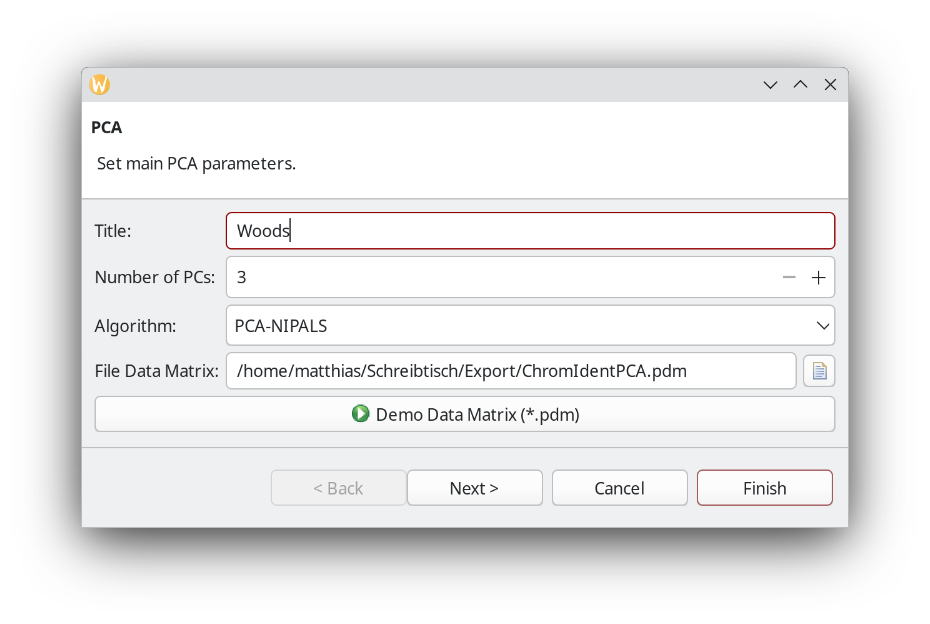
Click the green play button with the "Run the multivariate analysis." tooltip. A view into the 2D score plot confirms our hunch that we are dealing with a wood sample of similar origin as Betula pendula.
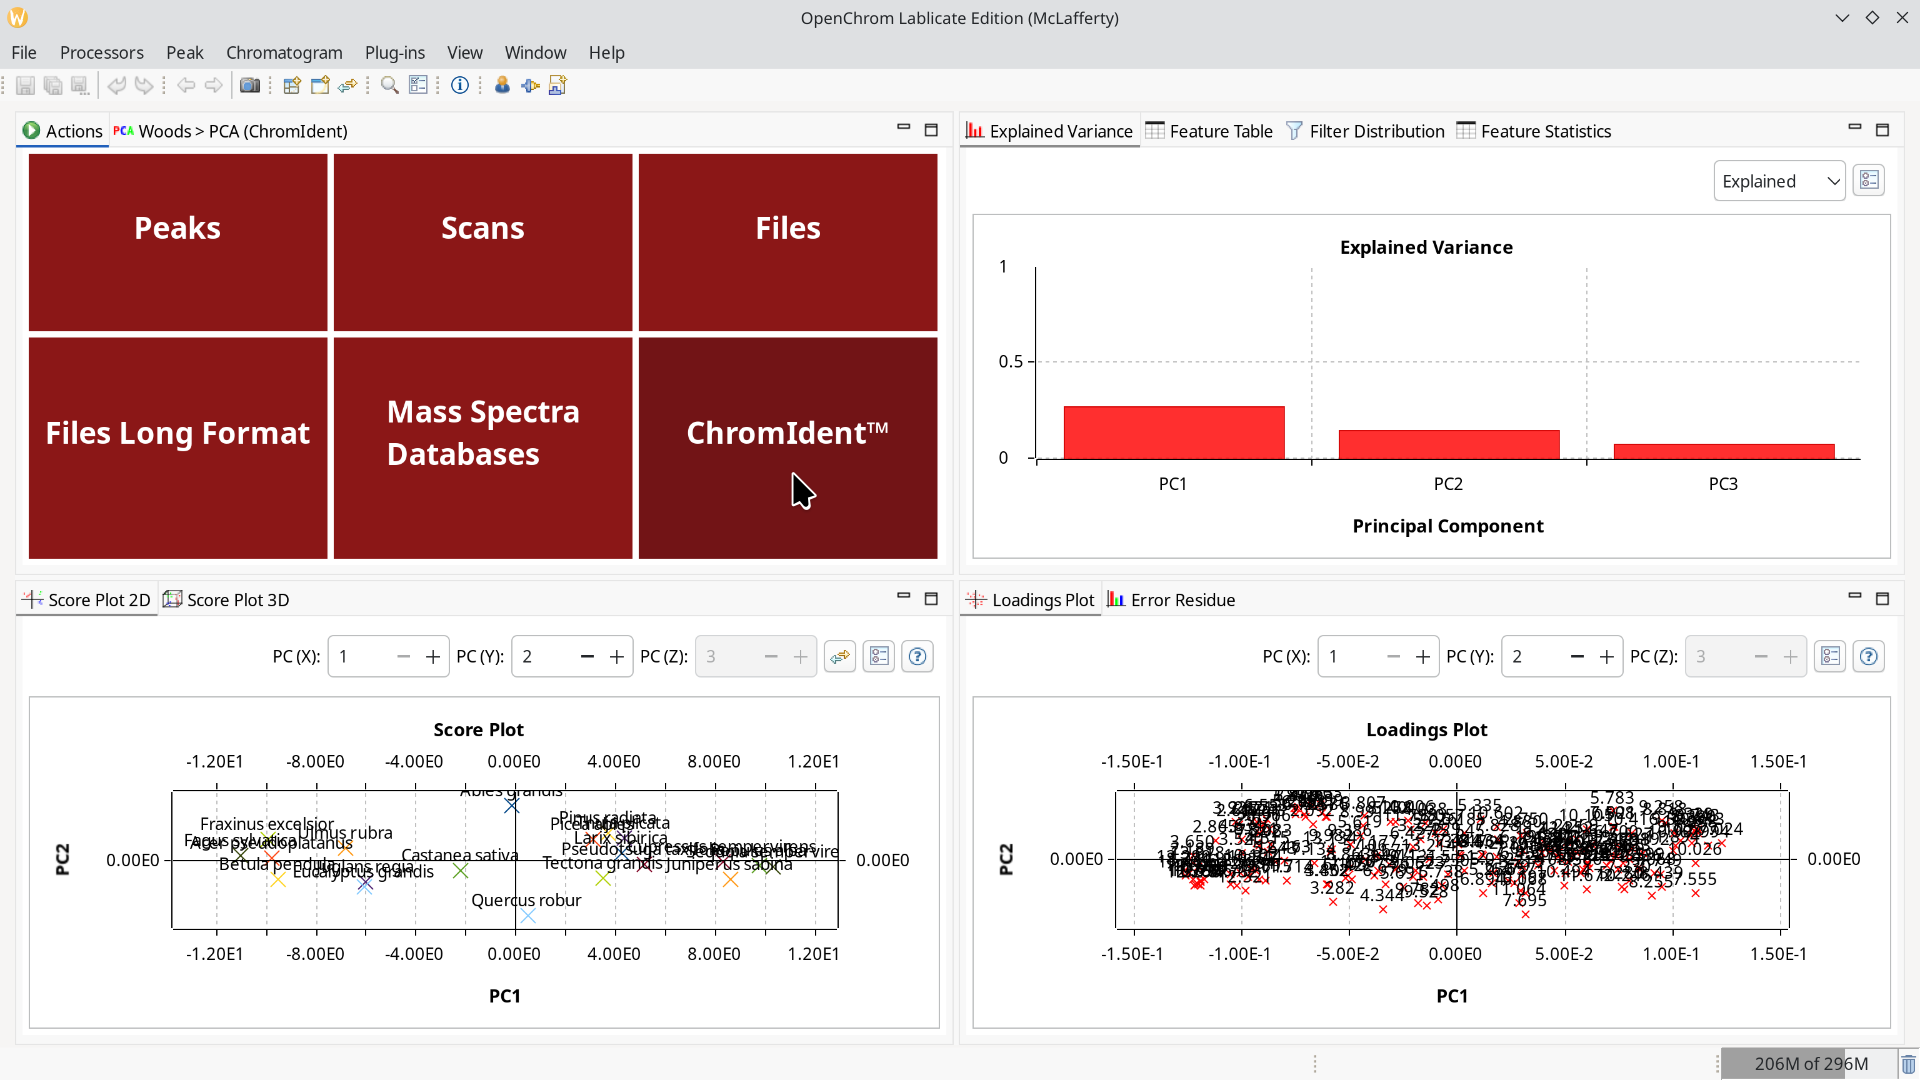
It is also possible to inspect a ChromIdent™ database with this PCA perspective and determine which peaks are good markers to distinguish them.
If you are looking for an all-in-one solution to analyze microplastics with Py-GC/MS with a bundled database, take a look at the official ChromIdent-Pyro-Bundle from our solutions partner Gerstel.


